How to use Guru for market research
How Guru subscriptions work in ChartGuru—setup wizard, schedules, reading reports, plan limits, and the in-app Page tour.
Guru is ChartGuru's autonomous AI research agent. You pick an asset, set a delivery schedule, and Guru synthesizes technical structure, fundamental context, news, and risk into structured research reports, delivered to your inbox and shown in the app.
This guide walks through the Guru page in ChartGuru: how subscriptions work, how to read a report, plan limits, and how to fit Guru into your research process across stocks, crypto, forex (FX), metals, and indices.
If you are new to the platform, start with What is ChartGuru? for a full product overview.
Learn the page in the app
Guru is a four-step setup wizard, not a chat box. The fastest way to learn the layout is the built-in tour:
- Sign in and open Guru from the sidebar.
- In the top bar, click Take tour → Page tour.
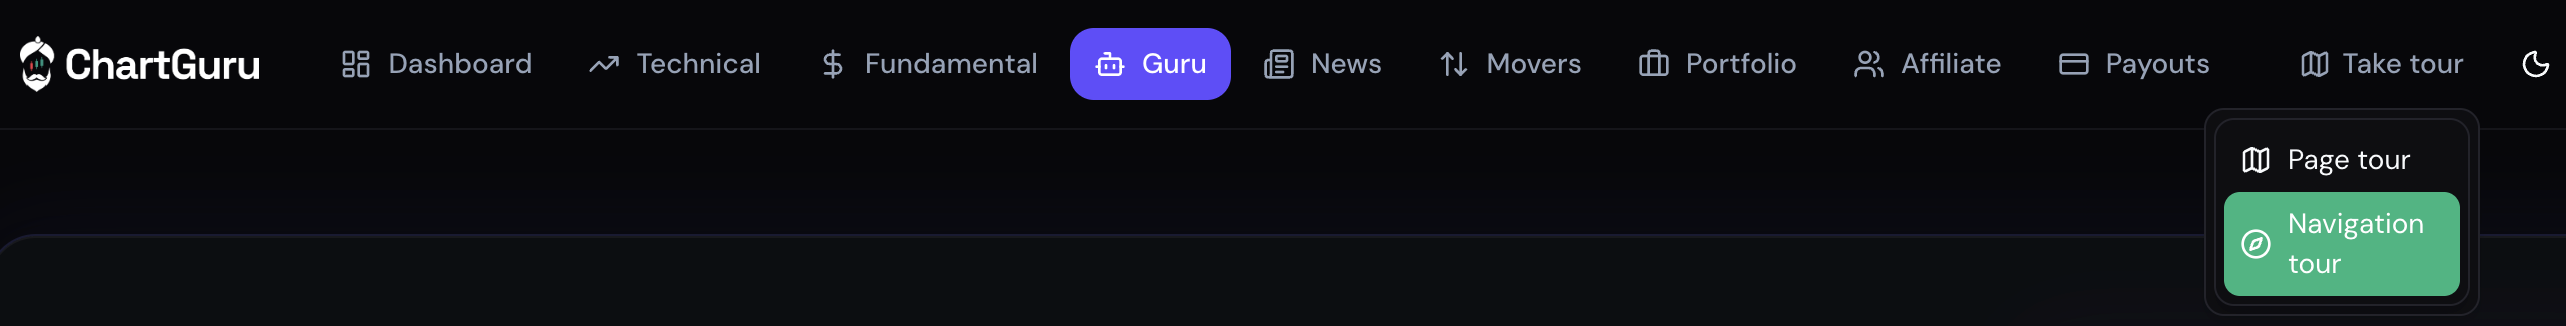
Use Navigation tour to see where Guru lives in the app. On the Guru page, use Page tour for the setup wizard and subscriptions.
The Page tour highlights your plan usage, the setup wizard, asset search, popular symbols, and subscription cards. If you are new to ChartGuru overall, Take tour → Navigation tour explains how Guru fits next to Technical, Fundamental, News, and Portfolio.
If Guru is not on your plan yet, you will see the Guru access page. It has its own tour for limits and upgrade options.
What Guru does (and does not do)
Guru reads across data already inside ChartGuru (indicators, fundamentals, headlines, and risk context) and returns a structured report with an overall rating, confidence score, key takeaway, and (when available) a price target.
Guru helps you:
- Automate recurring research on symbols you follow (daily, weekly, or monthly)
- Generate a one-time report on demand (Professional plan)
- Shape reports with investment style, time horizon, and focus-area preferences
- Get a repeatable starting point before deeper chart work
Guru does not:
- Accept free-text prompts or run as a conversational chat
- Execute trades or connect to a brokerage
- Replace your judgment, especially around position sizing and risk tolerance
- Guarantee accuracy; markets change and reports can go stale
Treat Guru as a research accelerator on autopilot, not an oracle.
Plan access and limits
Guru subscriptions require a paid plan (Starter or higher). Limits inside the app:
| Plan | Guru subscriptions | Generate now (one-time) |
|---|---|---|
| Free | Not available | Not available |
| Starter | Up to 2 active | Not available |
| Professional | Up to 20 active | Available |
| Enterprise | Unlimited | Available |
The usage tracker at the top of the Guru page shows how many subscriptions you have and your monthly creation limits. Upgrade from the Guru page or Pricing when you hit a cap.
Create a Guru subscription (four steps)
The wizard mirrors the Page tour. Each step maps to one screen in the app.
Step 1: Choose your asset
- Pick a market type: crypto, stocks, FX, metals, or indices.
- Search for a ticker or tap a popular symbol chip.
- Confirm you have the right symbol (e.g. BTC vs a similarly named equity).
Step 2: Set your schedule
| Frequency | What happens |
|---|---|
| Now | One-time report generated immediately (Professional+ only) |
| Daily | Recurring report at a time you pick (your device timezone) |
| Weekly | Recurring report on a weekly cadence |
| Monthly | Recurring report on a monthly cadence |
Daily reports use the time picker on this step. Weekly and monthly runs are scheduled server-side from your signup time; exact email arrival can vary slightly by provider.
Step 3: Research preferences
Tune what goes into each report:
- Investment style: conservative, balanced, aggressive, or AI-optimized
- Time horizon: short, medium, long, or all timeframes
- Focus areas (pick at least one): fundamental analysis, technical analysis, AI/ML predictions, market news & events, risk assessment
These preferences shape the report; they are not custom prompts. Use them to match how you actually trade.
Step 4: Email and confirm
- Reports are delivered to the email you enter (defaults to your account email).
- Review the subscription summary, then click Create Subscription or Generate Report Now.
For Now subscriptions, the report generates immediately and appears in your subscription list. For recurring schedules, the first report arrives on the next scheduled run.
Manage your subscriptions
Below the wizard, Your research subscriptions lists every active Guru report:
- Expand a card to read the latest report in the app.
- Pause / resume recurring subscriptions with the Active toggle (one-time Now subscriptions cannot be paused).
- Delete when you no longer need coverage on a symbol.
- Watch for a May be outdated tag; regenerate or wait for the next scheduled report after major news.
You cannot create duplicate active subscriptions for the same ticker and frequency. Delete or pause the old one first if you want to change schedule or email.
How to read a Guru report
Every report is structured like a desk analyst's note, not a buy signal. Focus on these layers:
1. Overall rating and confidence
Guru shows a rating (e.g. Strong Buy through Strong Sell) and a confidence percentage. Confidence reflects how strongly the available inputs align with the stated view. It is not certainty, a probability of profit, or a guarantee of returns. Ask: does this match what I see on the chart?
2. Key takeaway
The executive summary in plain language. Use it as the thesis to verify, not the final word.
3. Price target and spot price
When shown, compare the target to price at report time. A large gap between spot and target should prompt extra skepticism, especially on volatile assets.
4. Time horizon
Check that the report's horizon matches yours. A medium-term bullish read does not justify an intraday counter-trend entry without a separate check.
5. Stale reports
If the card shows May be outdated, treat levels and catalysts as suspect until a fresh report runs, especially after earnings, FOMC, CPI, or breaking headlines.
Cross-reference levels with the support and resistance guide when you mark them on your chart.
A practical research workflow (after Guru delivers)
Guru gives you the first pass. Your job is verify → risk-manage:
Step 1: Read the report Note the rating, confidence, takeaway, and any price target.
Step 2: Verify on the chart Open the Technical workspace for the same symbol. Do cited levels and trend structure match? Add your own indicators if that is part of your process.
Step 3: Check news and fundamentals Scan the News feed for headlines the report may not have weighted. A breaking story can obsolete a brief quickly. For stocks and longer holds, spot-check the Fundamental tab.
Step 4: Decide and define risk Only now decide whether to act, wait, or pass. Size and stops belong to your rules, not Guru's confidence score alone.
This is the same synthesize → verify → risk-manage loop described in How to combine news and technical analysis.
Example setups by asset class
Stocks: earnings week
- Create a daily or weekly Guru subscription on your ticker with market news and fundamental analysis enabled.
- Before earnings, read the latest report, then confirm the date in News and Fundamental.
- Mark pre-earnings support/resistance on the daily chart.
- After the print, wait for the next scheduled report, or use Generate now on Professional if you need an immediate refresh.
Crypto: momentum watchlist
- Subscribe to BTC or an alt on a daily schedule with technical analysis and market news enabled.
- When a report flags continuation or exhaustion, verify on the chart before adding size.
- Crypto reversals are fast. Use invalidation levels for stops, not confidence alone.
FX: macro swing
- Subscribe to a major pair (e.g. EURUSD) with all timeframes or medium-term horizon.
- Cross-check the economic calendar around CPI and central bank speakers.
- Stand aside during the first minutes after major data if you are not experienced with event volatility.
Metals: gold bias
- Subscribe to GOLD with fundamental analysis and market news for macro context.
- Compare the report's rates/dollar narrative to your own macro view.
- Use levels for timing within the bias, not as a substitute for macro judgment.
Common mistakes
- Treating the report as a trade signal: Guru summarizes research; you own the decision and the risk.
- Expecting a chat interface: Guru uses subscriptions and preferences, not free-text prompts.
- Ignoring stale tags: Refresh after material news or wait for the next scheduled delivery.
- Timeframe mismatch: A bullish weekly read does not justify an intraday fade without a separate check.
- Forgetting plan limits: Starter caps at two subscriptions; upgrade your plan before building a large watchlist.
- Skipping verification: The highest-confidence report is still wrong if price has already broken structure.
Frequently asked questions
What is Guru in ChartGuru? Guru is an autonomous AI research agent. You create subscriptions per symbol; reports combine technical, fundamental, news, and risk context on a schedule you choose.
Do I need a paid plan? Yes. Guru subscriptions start on Starter. Generate now (one-time immediate reports) requires Professional or higher.
Can Guru analyze any symbol ChartGuru supports? Yes: crypto, stocks, FX, metals, and indices. Always confirm the correct ticker and market type in step 1.
How do I learn the Guru UI quickly? Open Guru and use Take tour → Page tour in the top bar.
How often should I get a new report? Match frequency to how you trade: daily for active symbols, weekly for swings, monthly for longer holds. Re-read or regenerate after major events.
Should I use Guru instead of learning technical analysis? No. Guru works best when you can verify output on a chart. See technical vs. fundamental analysis.
Can Guru help combine news and charts? Yes. That is built into the focus areas. For a dedicated framework, see combining news and technical analysis.
Getting started
- Sign up or log in
- Open Guru from the sidebar
- Run Take tour → Page tour if this is your first visit
- Complete the four-step wizard for your first symbol
- Read the report, then verify on Technical, News, and Fundamental before acting
Browse the Blog for more guides on analysis, risk framing, and platform workflows.
This article is for educational and informational purposes only. Nothing here constitutes personalized investment advice or a recommendation to buy or sell any financial instrument. AI-generated summaries can be incomplete or outdated. All trading involves risk of loss.